Introducing a model democracy
Recap: In the last part I introduced the three main sources of uncertainty in projections of future climate - now let’s discuss how climate scientists deal with them. When it comes to the possible emission paths, climate scientists, generally speaking, do not like to speculate about the probability of the scenarios (even though it has been argued that we should) and normally make analysis conditional to a given scenario. Internal variability, in turn, can be quantified, isolated, and investigated using different methods (such as so-called large model ensembles; more about model ensembles later) but it can not really be reduced as mentioned before. So, in my work I focus on model uncertainty as it is often considered to have the largest potential for reduction.
Model uncertainty is closely connected to the forced response which is basically the reaction of the climate system to the external (external from the perspective of the climate system) forcing applied to it by anthropogenic emissions. For example, we can’t know exactly how much the climate system will warm for a given amount of future CO2 emissions (i.e., forcing). Or, if we turn it around, we can’t know exactly how much more CO2 we can emit while still staying below a certain level of warming (this is the concept of carbon budgets). So in either case there is some uncertainty involved, which is reflected in the spread between estimates from the different models and the more we can (justifiably) reduce this uncertainty the better we know what to expect.
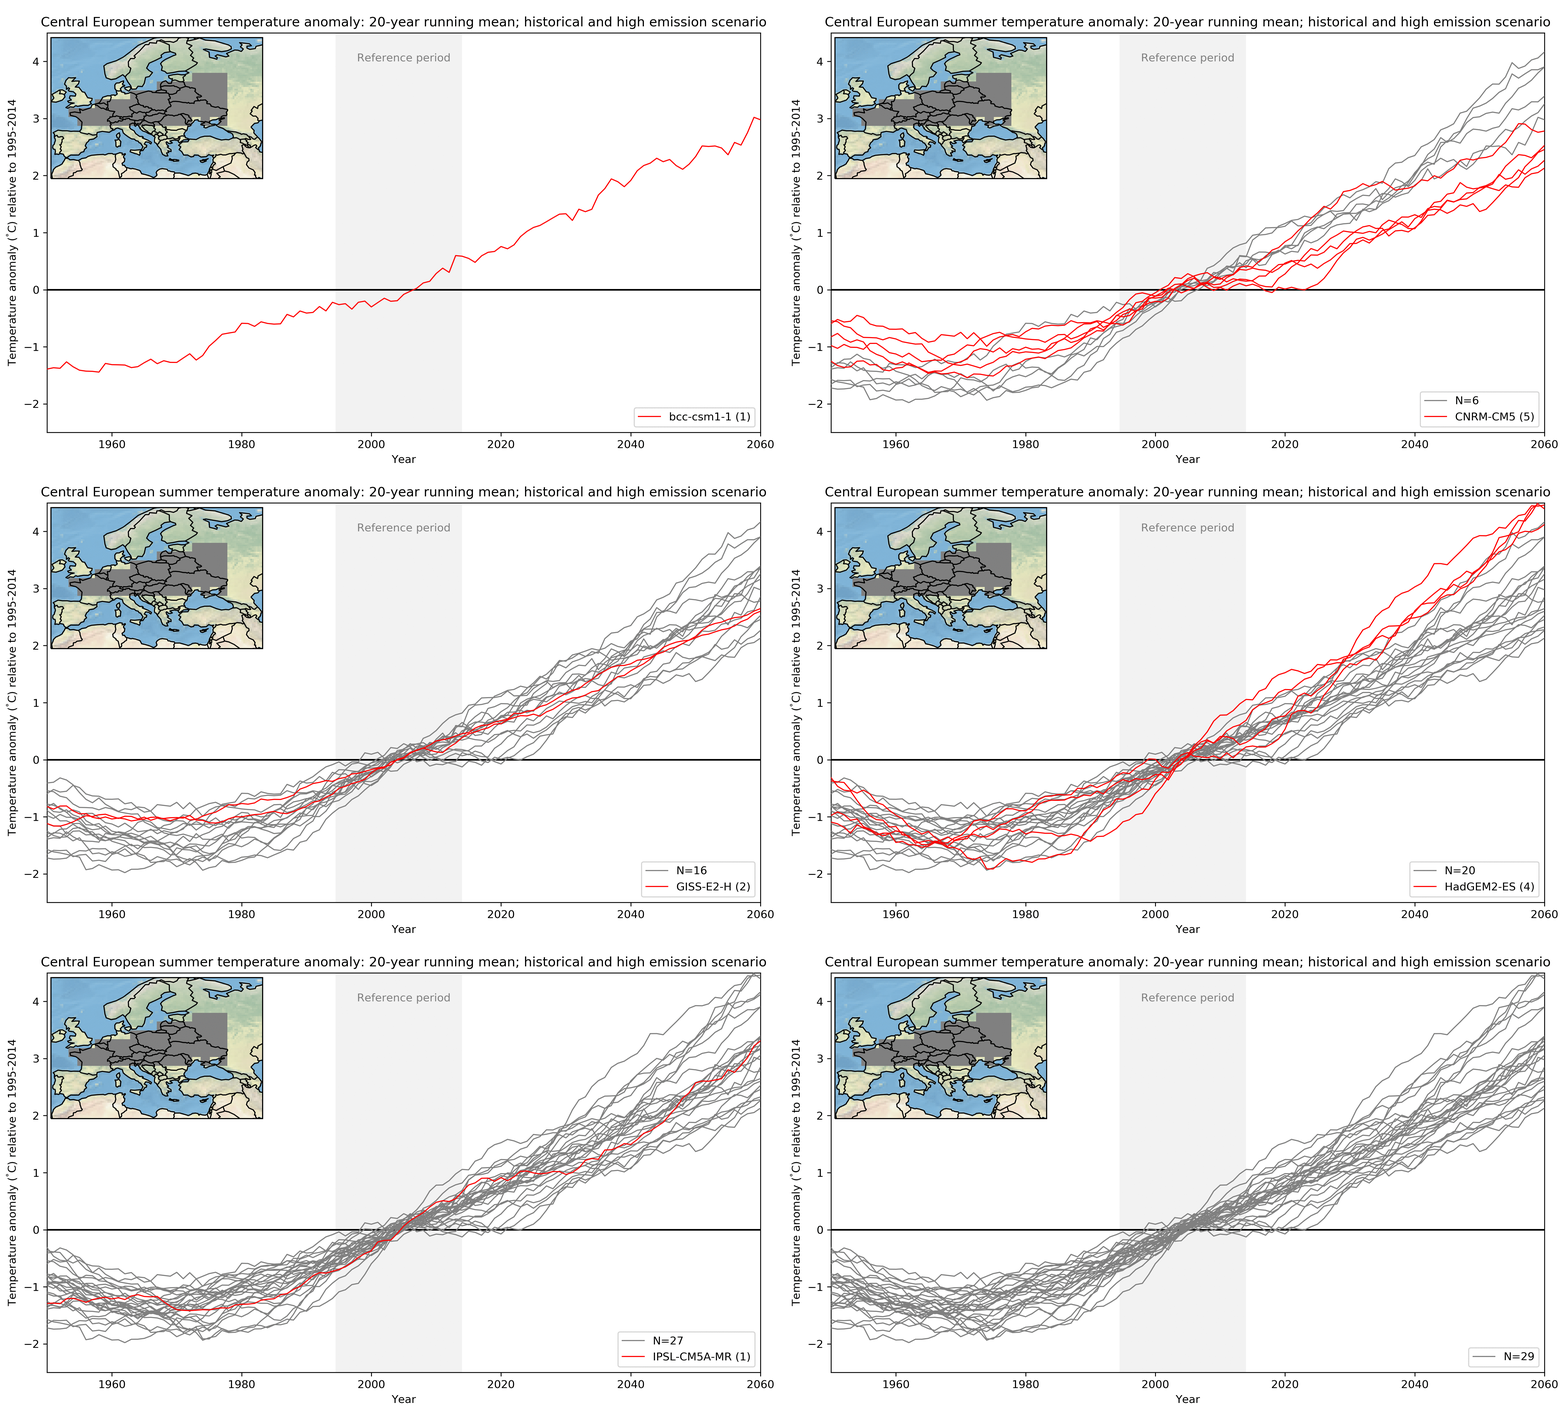
While in the last part I looked at global temperature, let us now consider something more relevant for decision makers (and maybe also the reader): here I show Central European summer temperature change (relative to 1995-2014) until the middle of the century. For simplicity I focus on the high emission path only (effectively disregarding scenario uncertainty). Most of the internal variability is removed by using a 20-year running mean as well as averaging over the region. In the figure below model after model is added (highlighted in red). You might notice that some models are represented by several lines. These are the ensemble members of a model mentioned earlier; they only differ due to the remaining internal variability (again more about that later). In total I here use 10 different models in 29 realisations.

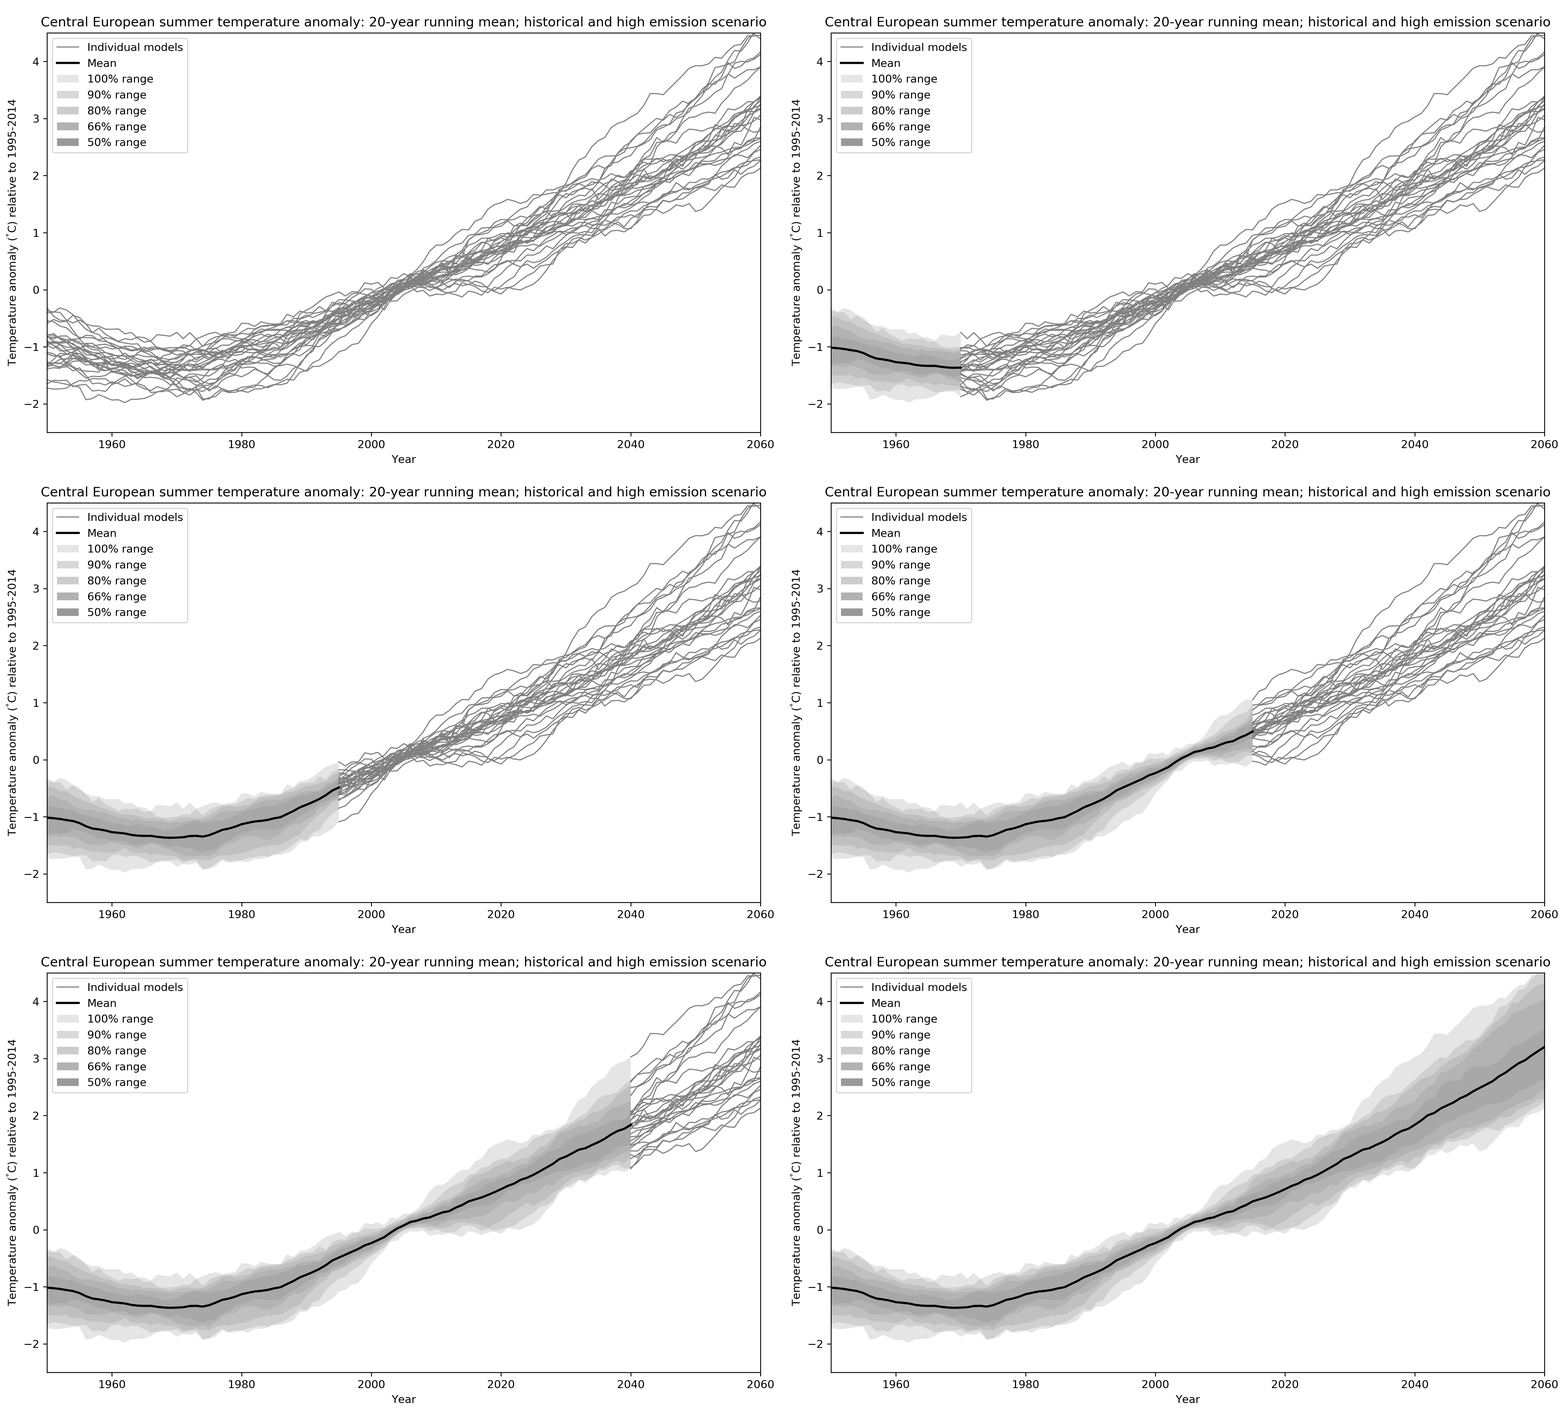
How do we get an estimate of uncertainty from all these lines? Well, the simplest thing is to just calculate statistics giving every run one vote in what has been called model democracy (paywall). There are several potential shortcomings of such an approach but it is still widely used because it is simple and easy to understand. In the figure below I replace the individual estimates of Central European Climate by some probability ranges. Doing so one important question that arises is: Do these ranges represent actual probabilities in the real climate system or, in other words, do we actually have a 50% chance of experiencing a warming within the 50% range? I will look into this question in more detail in my research.

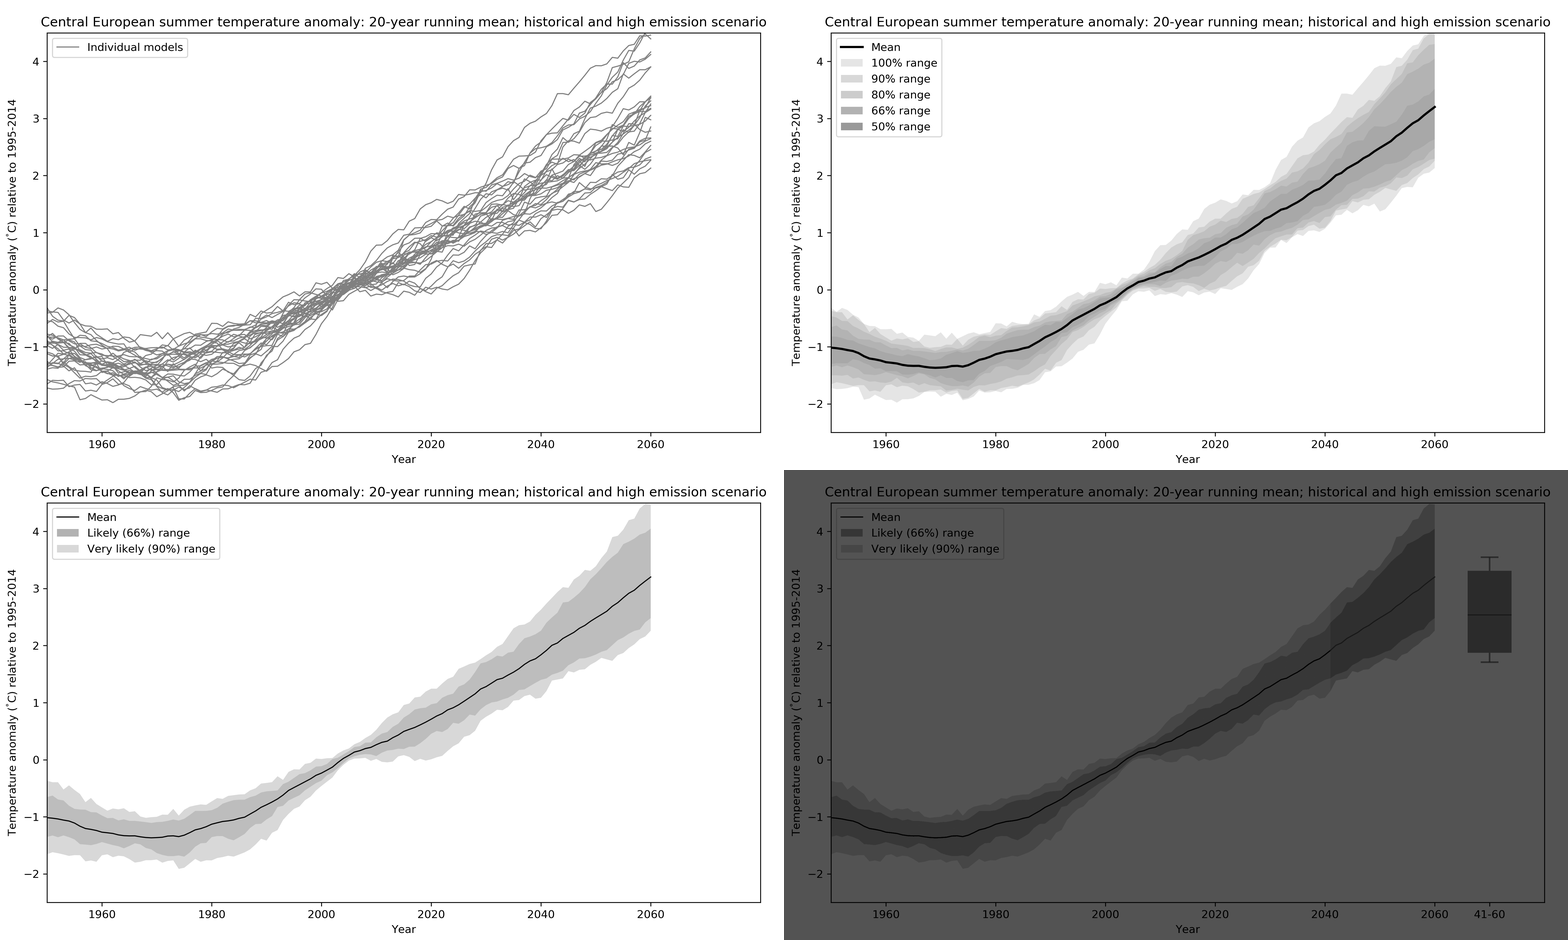
Wrap-up: It is clear from all models that more greenhouse gases lead to more warming, highlighting the need for rapid reductions in emission in order to close the gap to what is needed for the Paris agreement goals. Due to the complexity of the system different climate models give slightly different estimates of future changes (based on a given emission path). The simplest way of calculating the most likely warming and the related uncertainty around it is to assume model democracy and give each model one vote.
The figure below summarises the steps from the individual model estimates to a distribution of 20-year climatological change by the middle of the century (2041-2060). It focuses on mean change and two uncertainty ranges: 66% and 90% or what the the IPCC calls the likely and very likely ranges, respectively.

PS. You might wonder why the model uncertainty is so small around 2010. That is just a property of the anomaly calculation I’ve chose here: the change is with respect to 1995-2014, which means that approximately in the middle of this period each model has to cross the zero-line by design, restricting the spread.
PPS. You might also think that 2060 minus 2041 is really 19 and not 20 years. This is a subtle detail but when talking about years its more intuitive to count both the start- and end-year. If you consider, for example, the period 2041-2042 it becomes clear immediately that these are two years, namely 2041 and 2042. (I once even had to try and convince an Austrian quality newspaper about this but failed…)
