The Future of the Earth: an artistic interpretation of what could happen to our climate
Throughout early 2021 I was involved in a project with the title The Future of the Earth that implemented scientific data and expertise in an artistic setting. The basic idea was to allow the visitor to experience the consequences of our actions when it comes climate change mitigation and adaptation in (for me) totally new ways. During several days groups of actors, scientists, and visitors travelled into the future either along the low emission path SSP1-2.6 or along the high emission path SSP3-7.0 (see this article by CarbonBrief for an explanation about the SSPs and their narratives). During this journey the consequences of our actions could be seen, heard and felt in various ways.
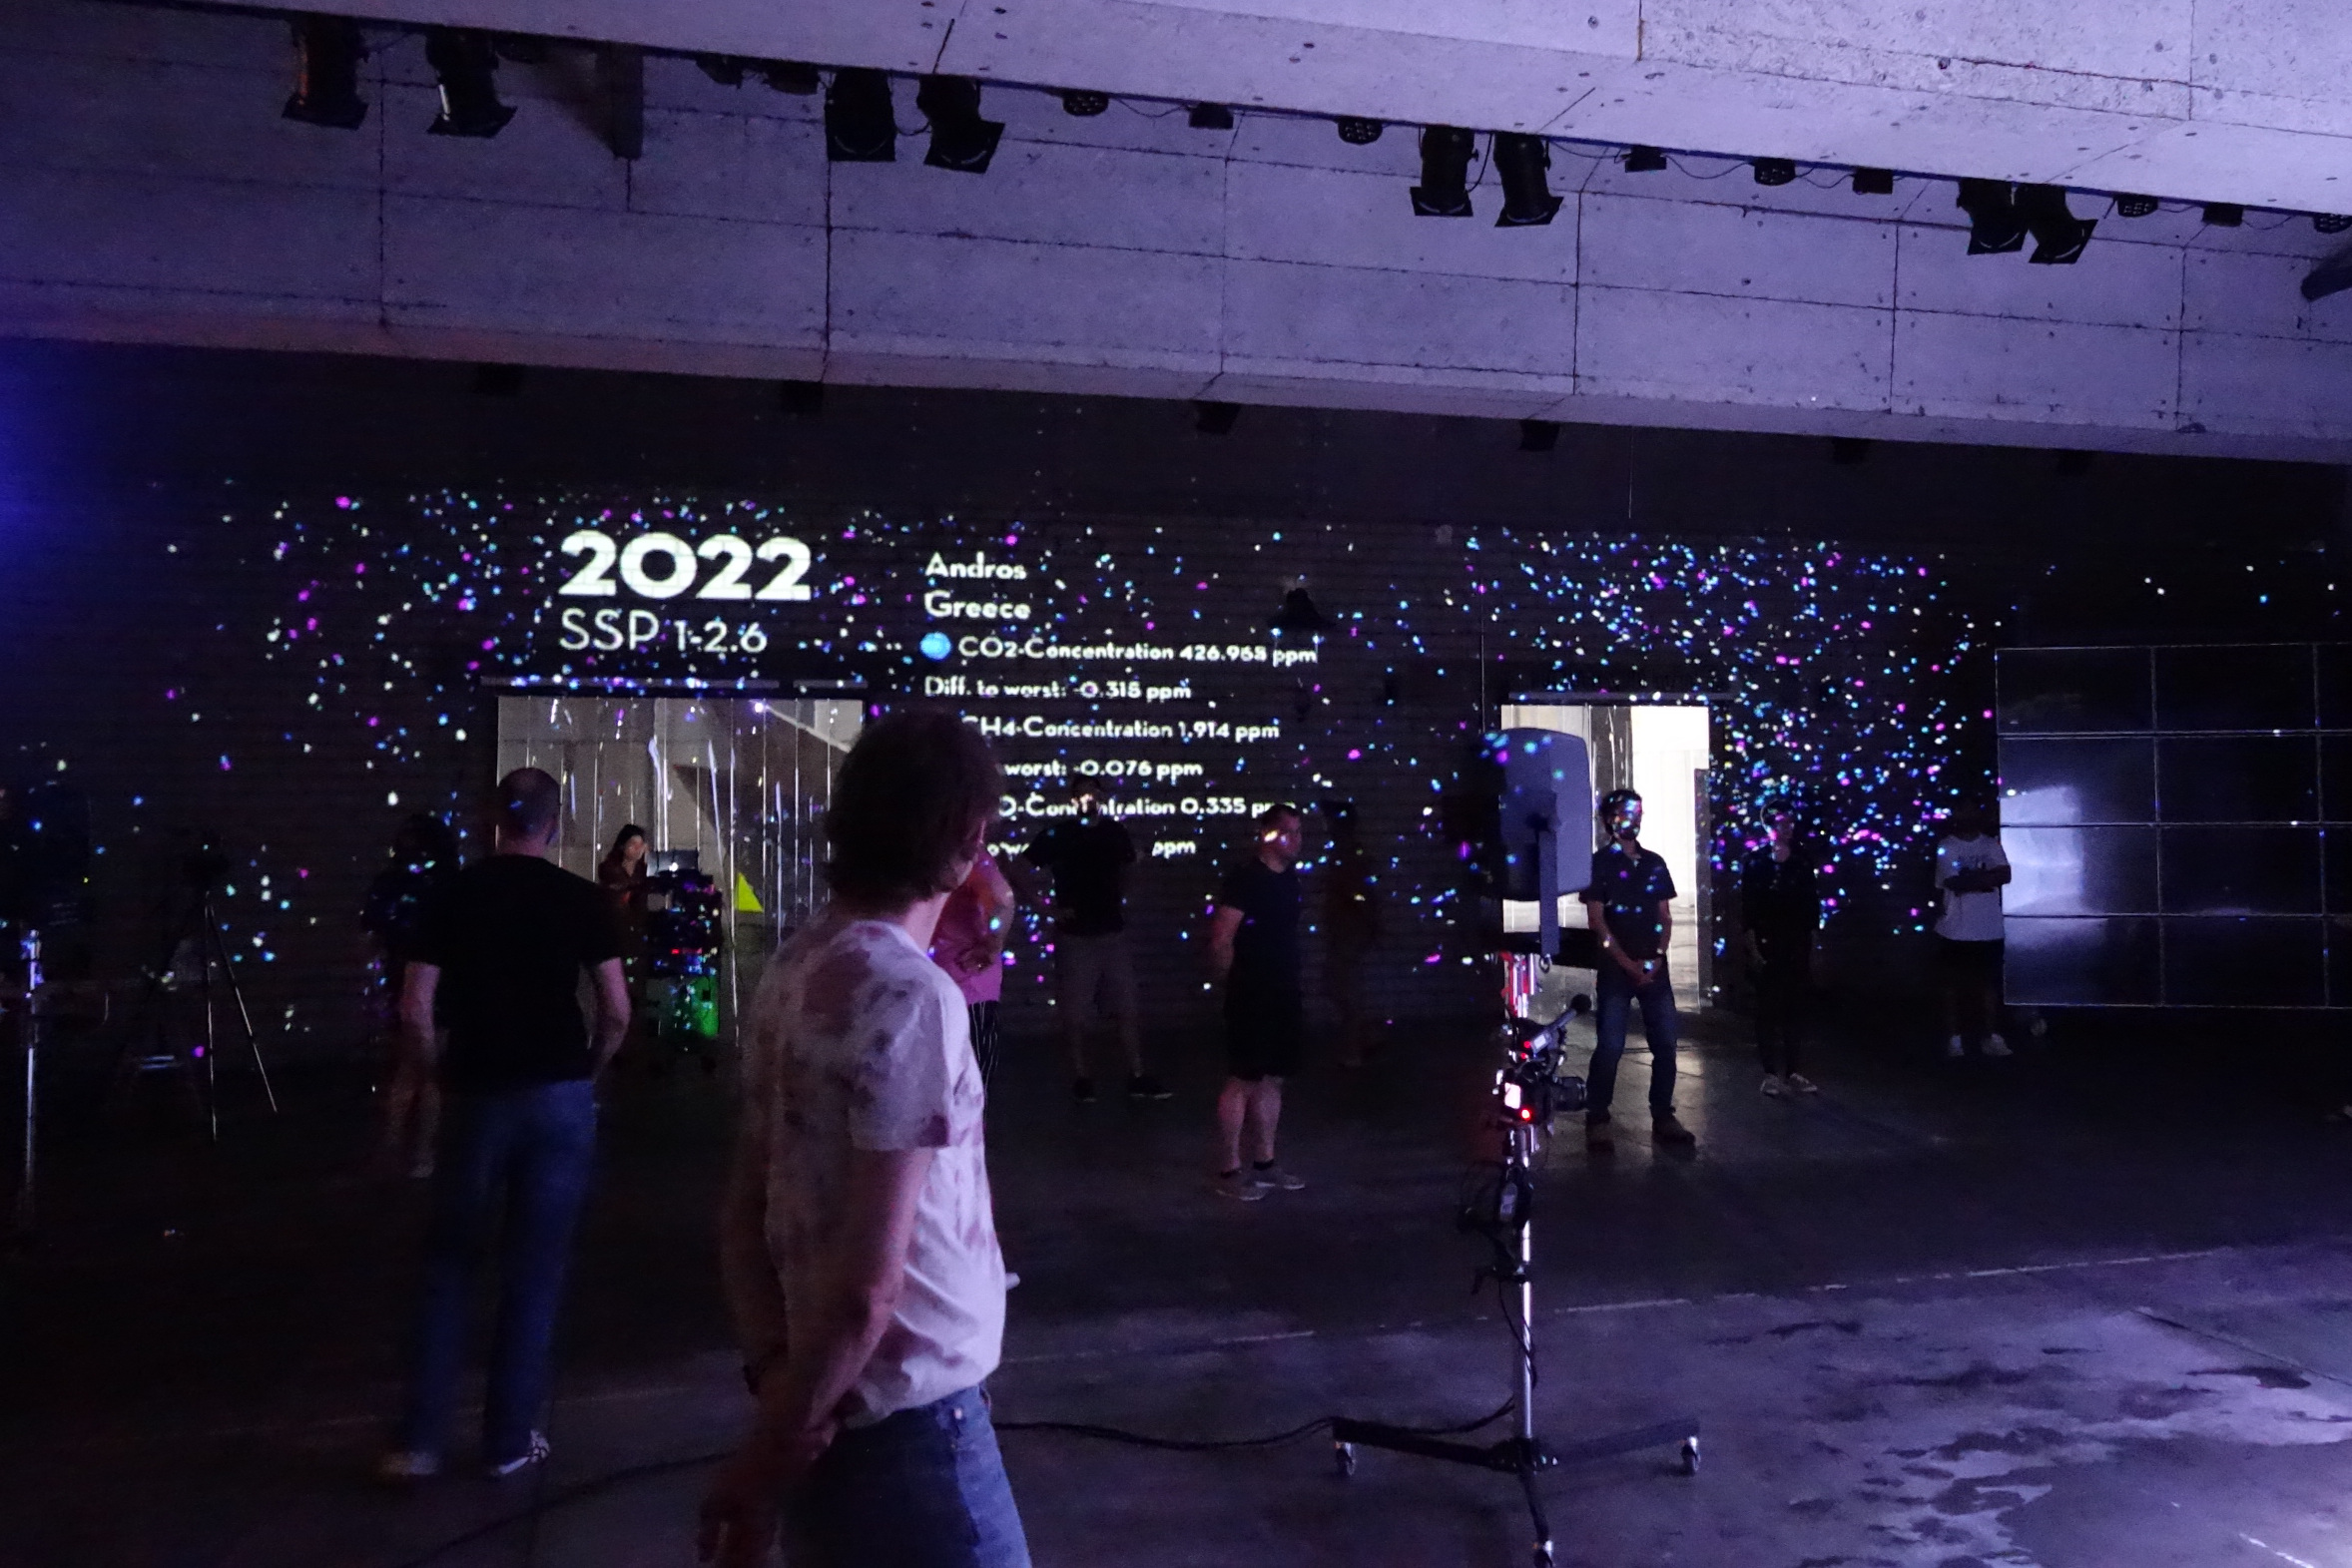
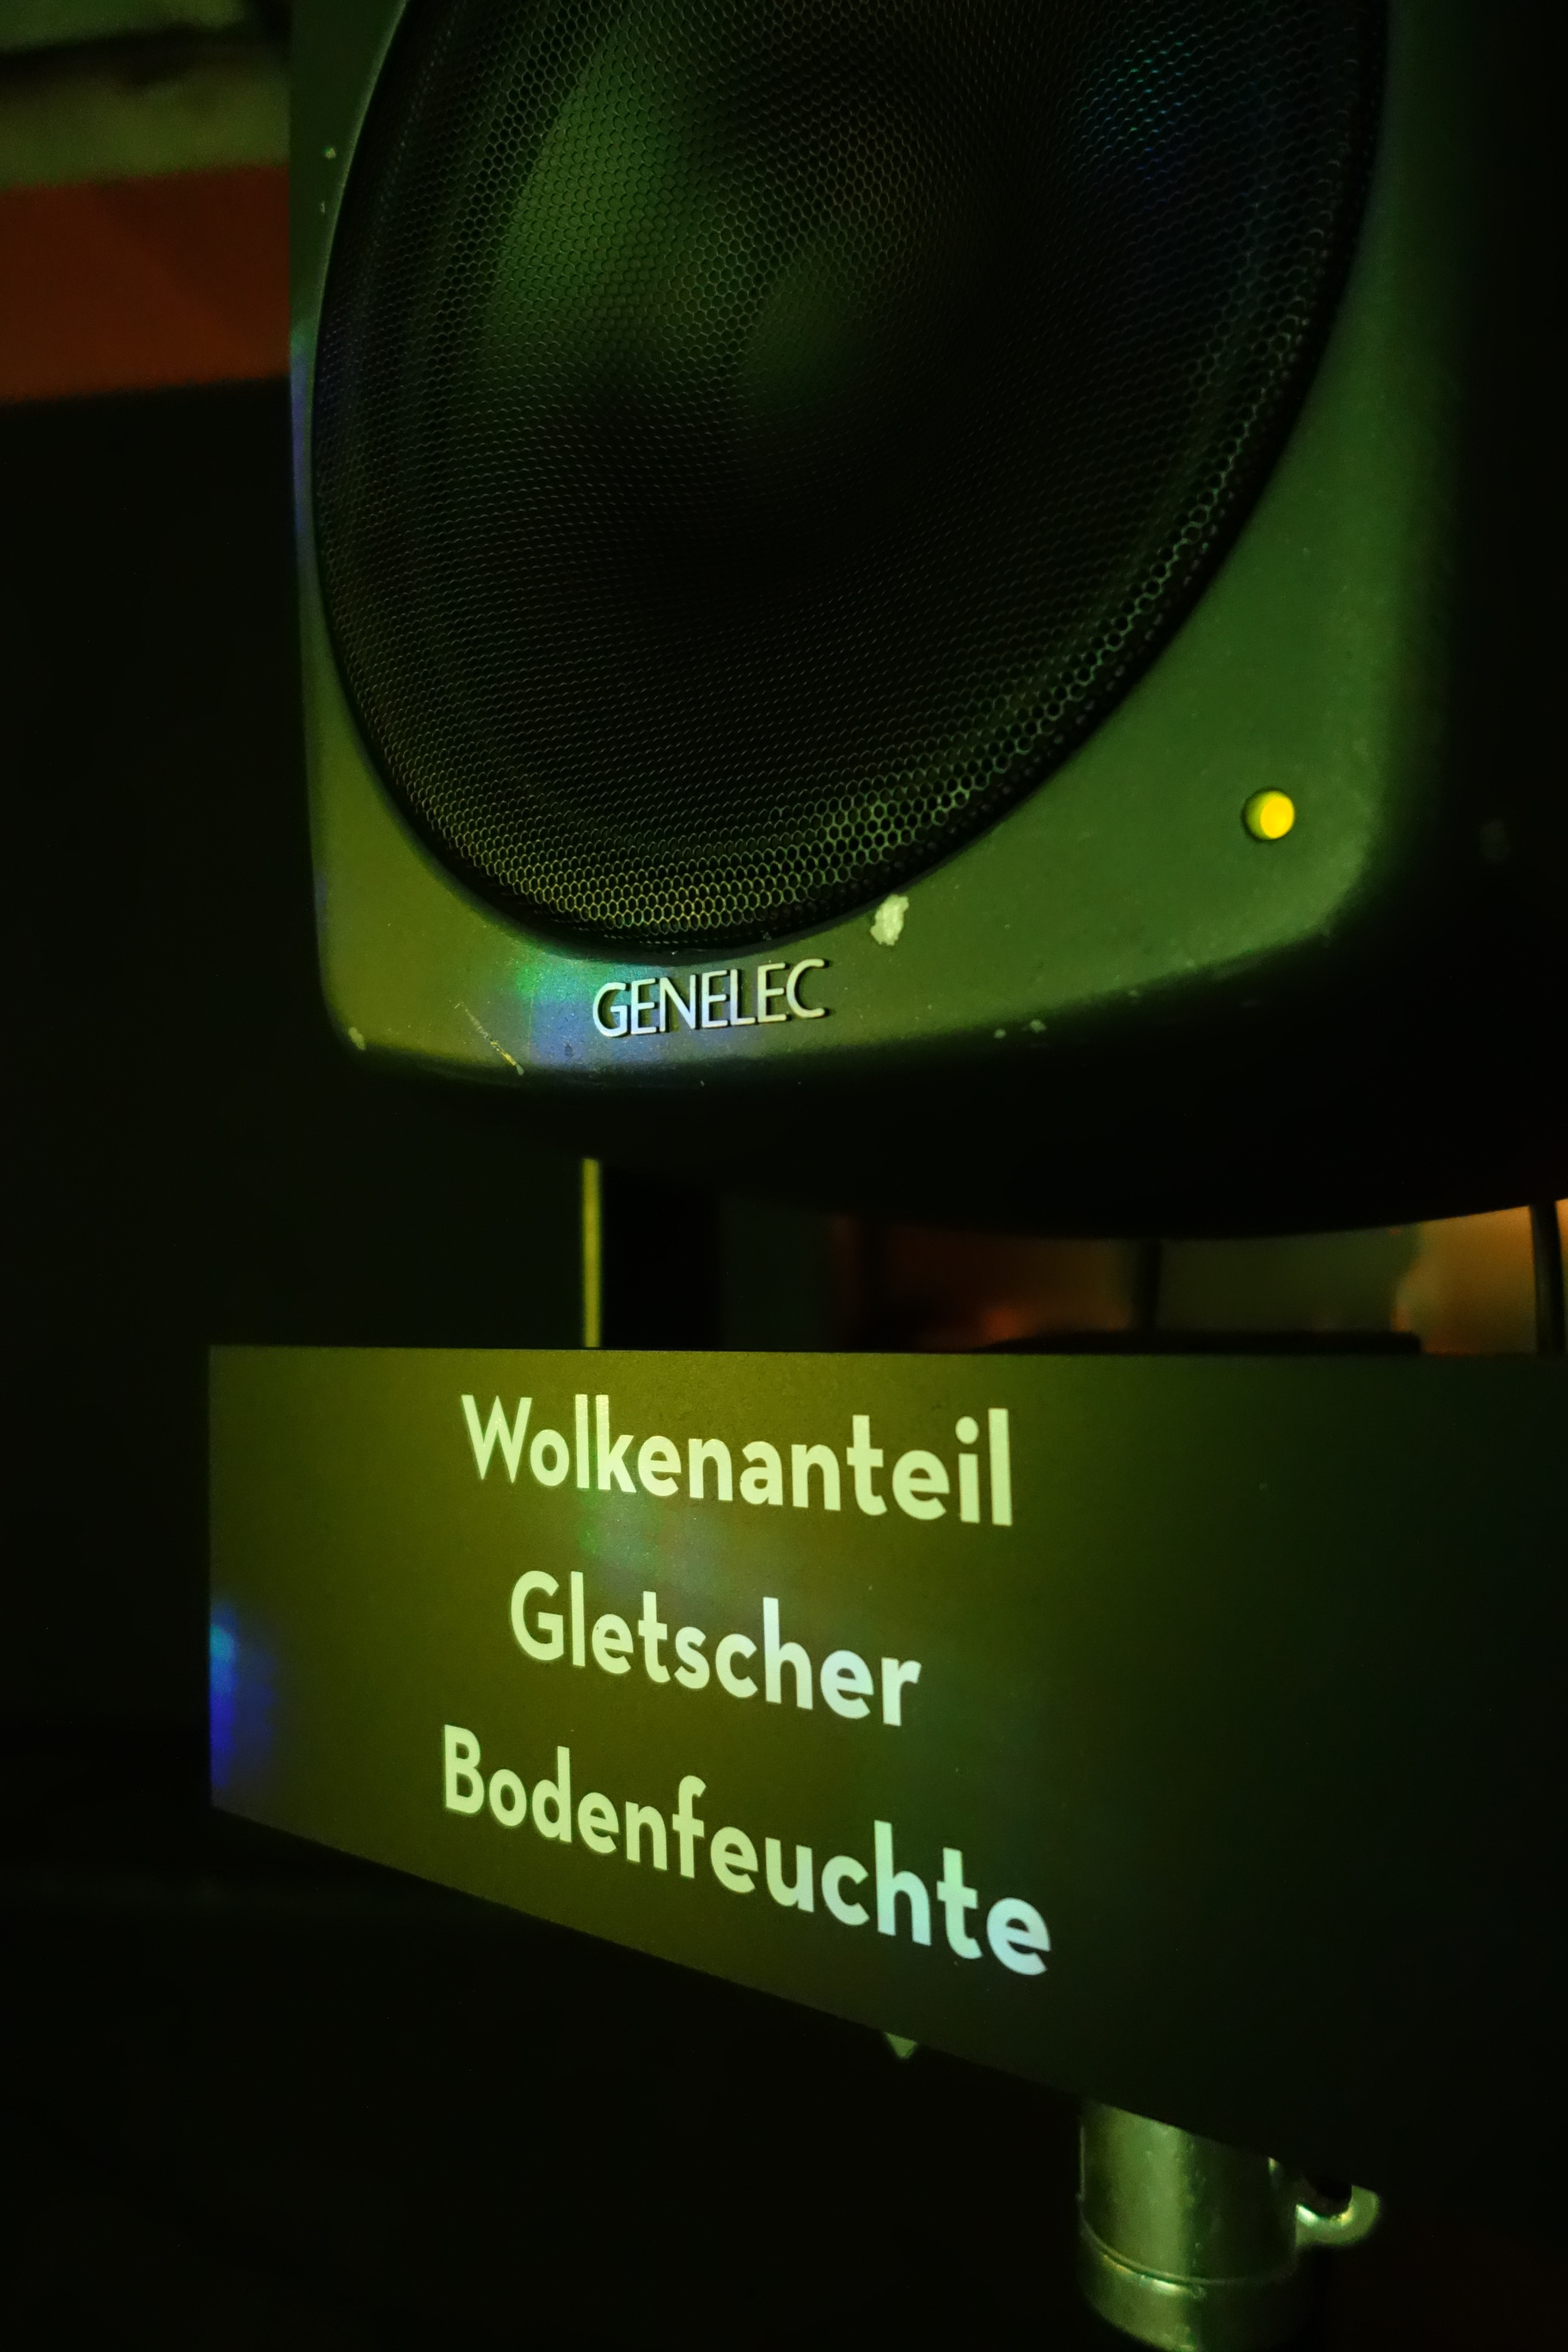
The impact of our actions on, for example, CO2 in the atmosphere, temperature, precipitation, the soil, and the glaciers could be heard and seen from various sources.
In the years 2050 and 2100 we made a stop and different experts (myself among them) were interviewed about how the climate had developed in the “past” decades. What struck me was how hard it was to talk about climate change from a future perspective and hence without the uncertainty that plays such an important role in our (scientific) assessment of the future. But it was the (unscientific) clear story of the past that made the experience so real for me.
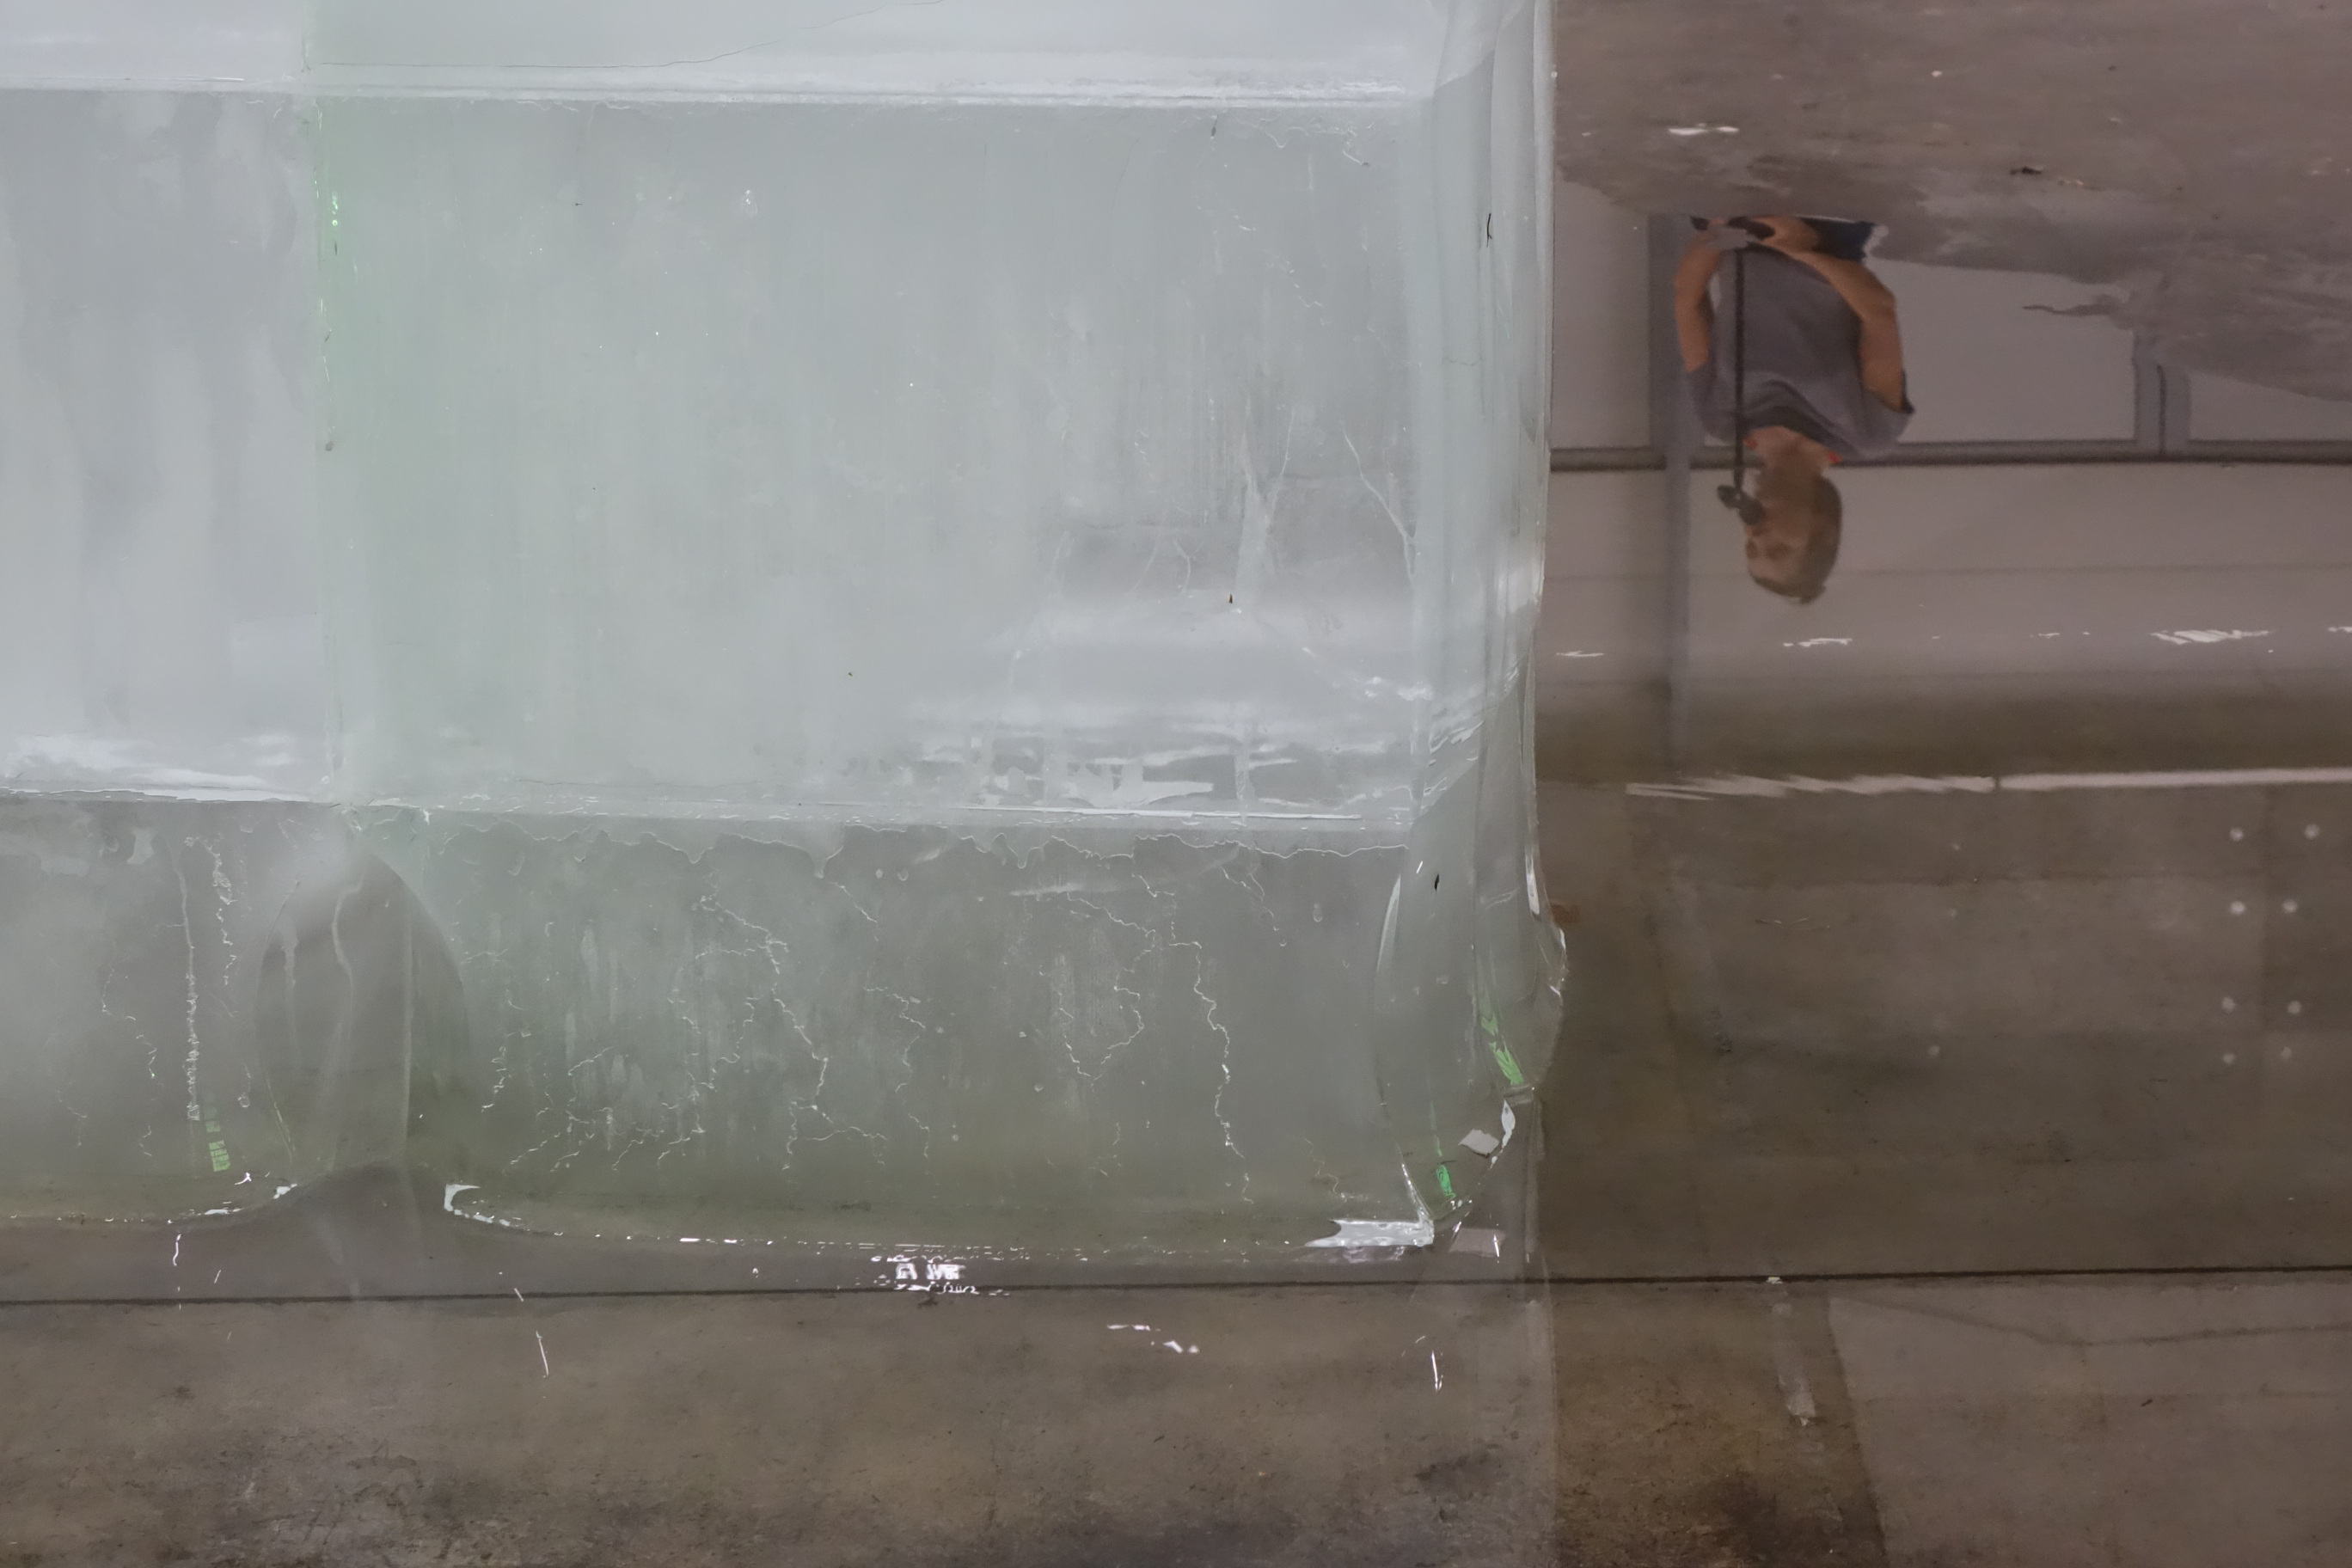
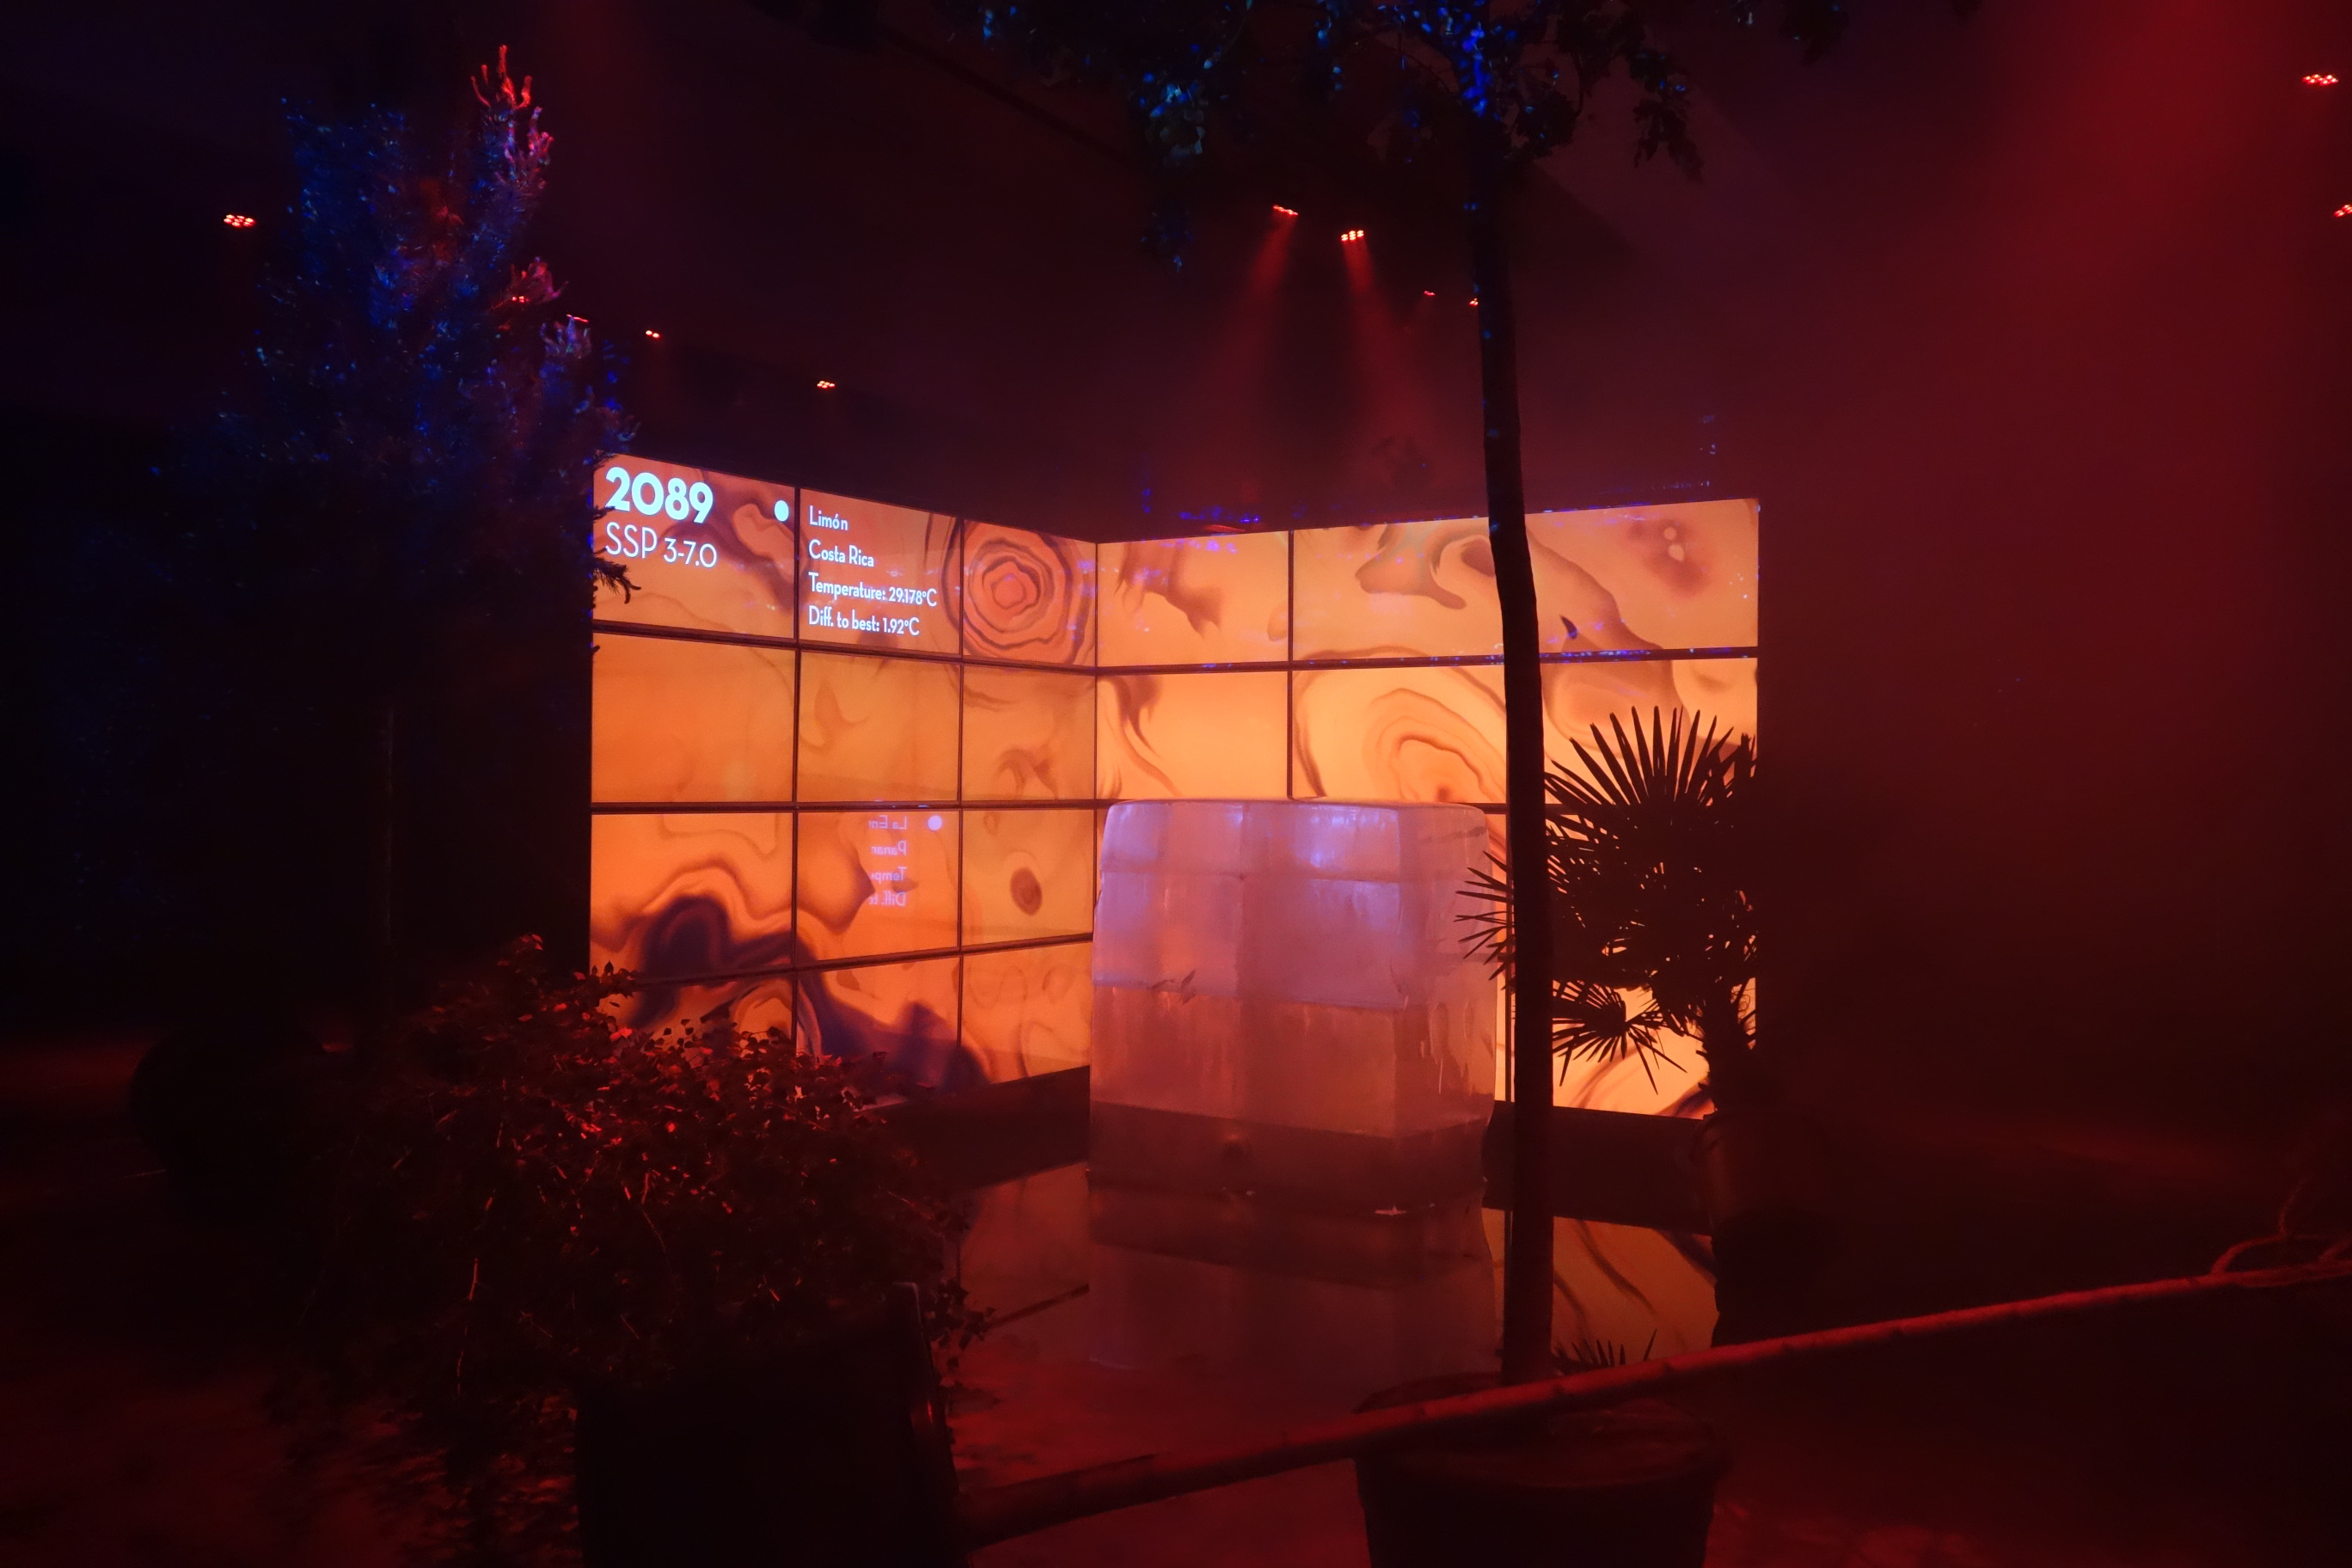
While we travelled into the future guided by a narrative of the decisions we as a society took, a large block of ice in the middle of the room slowly melted away, creating an increasingly large pool of water on the walkable stage.
In scientific results we tend to often only focus on numbers such as the difference in global temperature between low and high emission pathways. The acts allowed to really experience the effects of climate protection or continued dependence on fossil emission in totally different ways. What impressed me was how much more powerful the positive narratives with committed climate protection felt in this setting, while in science we often tend to focus more on the worst case scenarios.
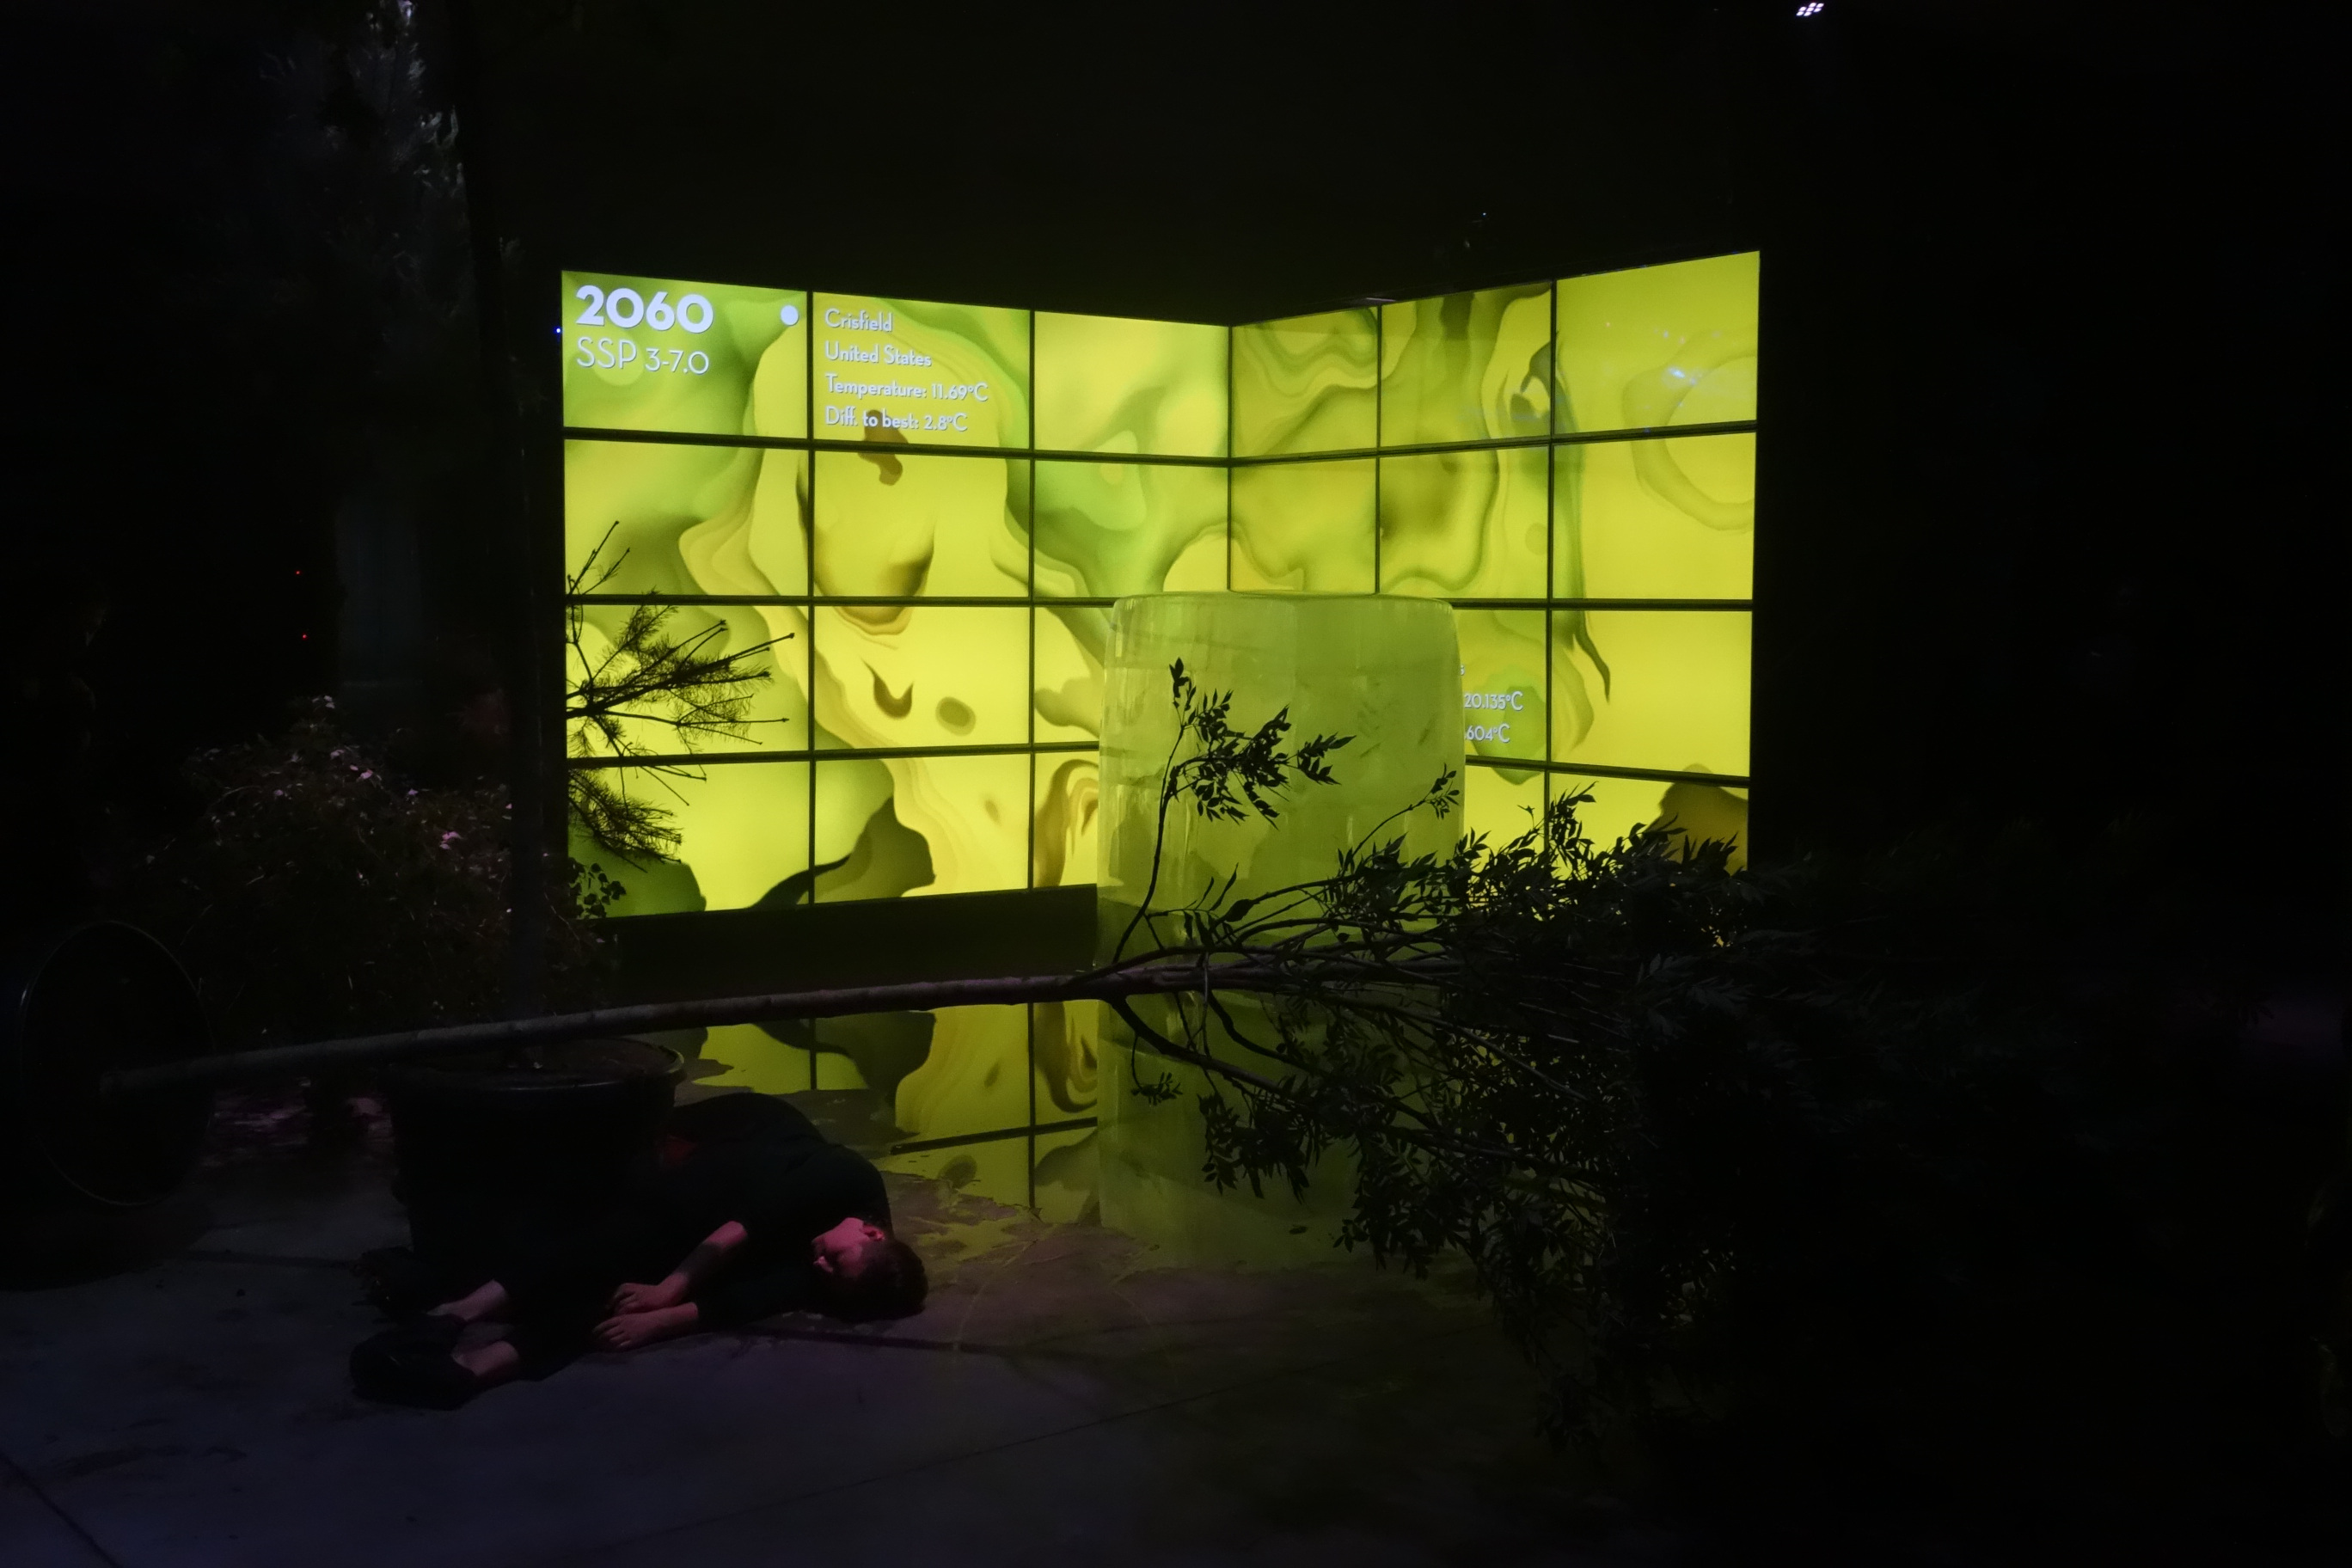
While the temperatures continue to rise along the high emission pathway SSP3-7.0 on the screens in the back the actors try to protect the trees from the effects of climate change.
I also provided the data the visualisations were based on and this made me realise how complex and inaccessible climate data can be for non-experts: variables have strange names and units, they are often multi-dimensional, and stored as binary files which can be hard to even open without dedicated tools. Among the things I did was to convert variables into intuitive units (precipitation, for example, is often given in kg m-2 s-1 by default), and providing them as 2-dimensional .csv files. The script I used is available on GitHub here and the processed csv files on Zenodo here.
For me personally it was amazing to experience the data I work with every day expressed in totally different ways. The block of ice in the middle of the room that melted throughout the days gave a sense of urgency I would have never imagined from such a slow process. I really hope to see more such projects – I think it is a great way of communicating possible impacts of climate change as more than just numbers.