Uncertainty in projections of future climate
While the warming of the climate system through the emission of man-made greenhouse gases is clear from observations, models, and our understanding of the climate system, projections of the future climate face a range of uncertainties. In the following I’m going to introduce the three most important sources of uncertainty and how my research can help to reduce them.
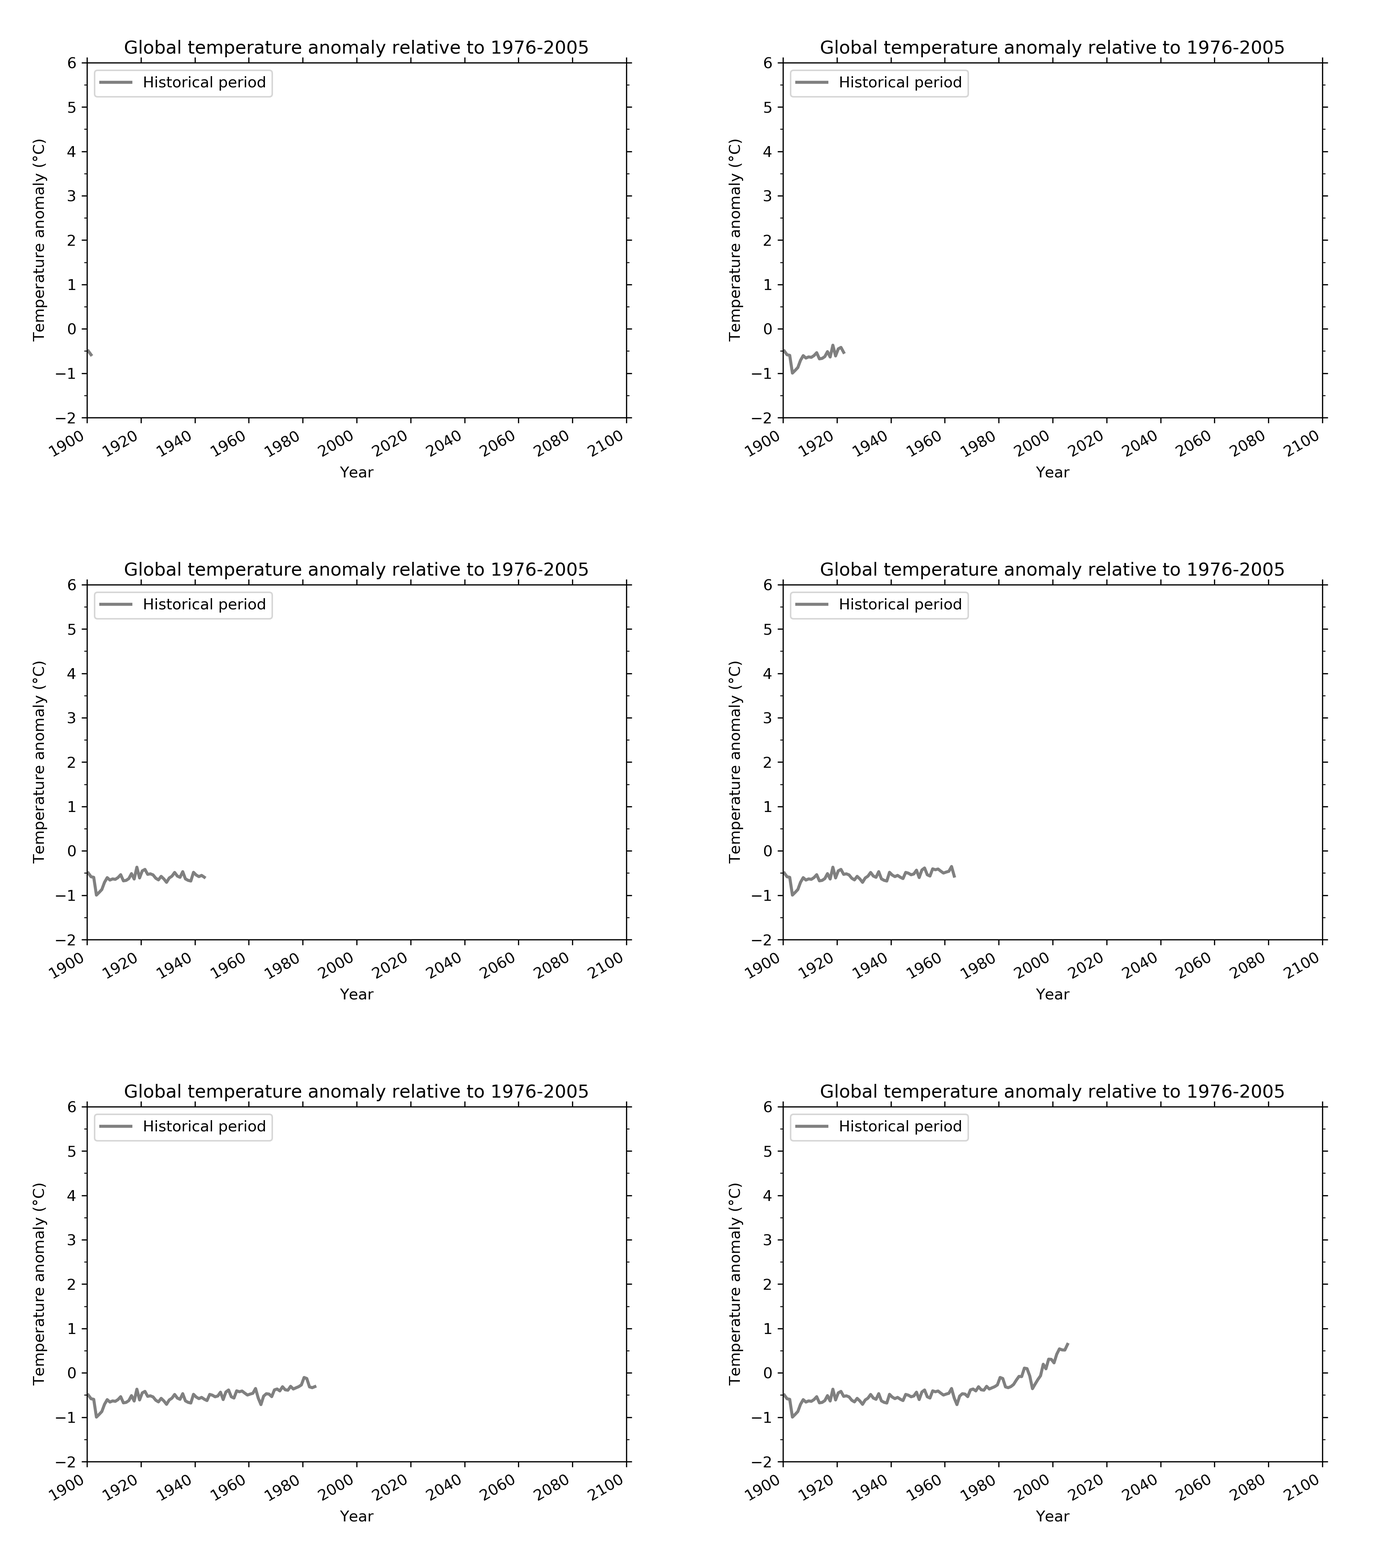
Internal variability stems from the fact that the Earth’s climate is an extremely complex and chaotic system. The animation below shows global mean temperature for the years 1900 to 2005 from one selected climate model. Ignoring a possible trend for now, the (seemingly random) fluctuations are referred to as internal variability and constitute one important source of uncertainty. In fact, internal variability cannot really be reduced since it is part of the climate system (however, one could potentially select temporal and spatial scales with lower natural variability – more about that later)
Deser at al. 2012a (paywall), Deser at al. 2012b, Martel et al. 2018
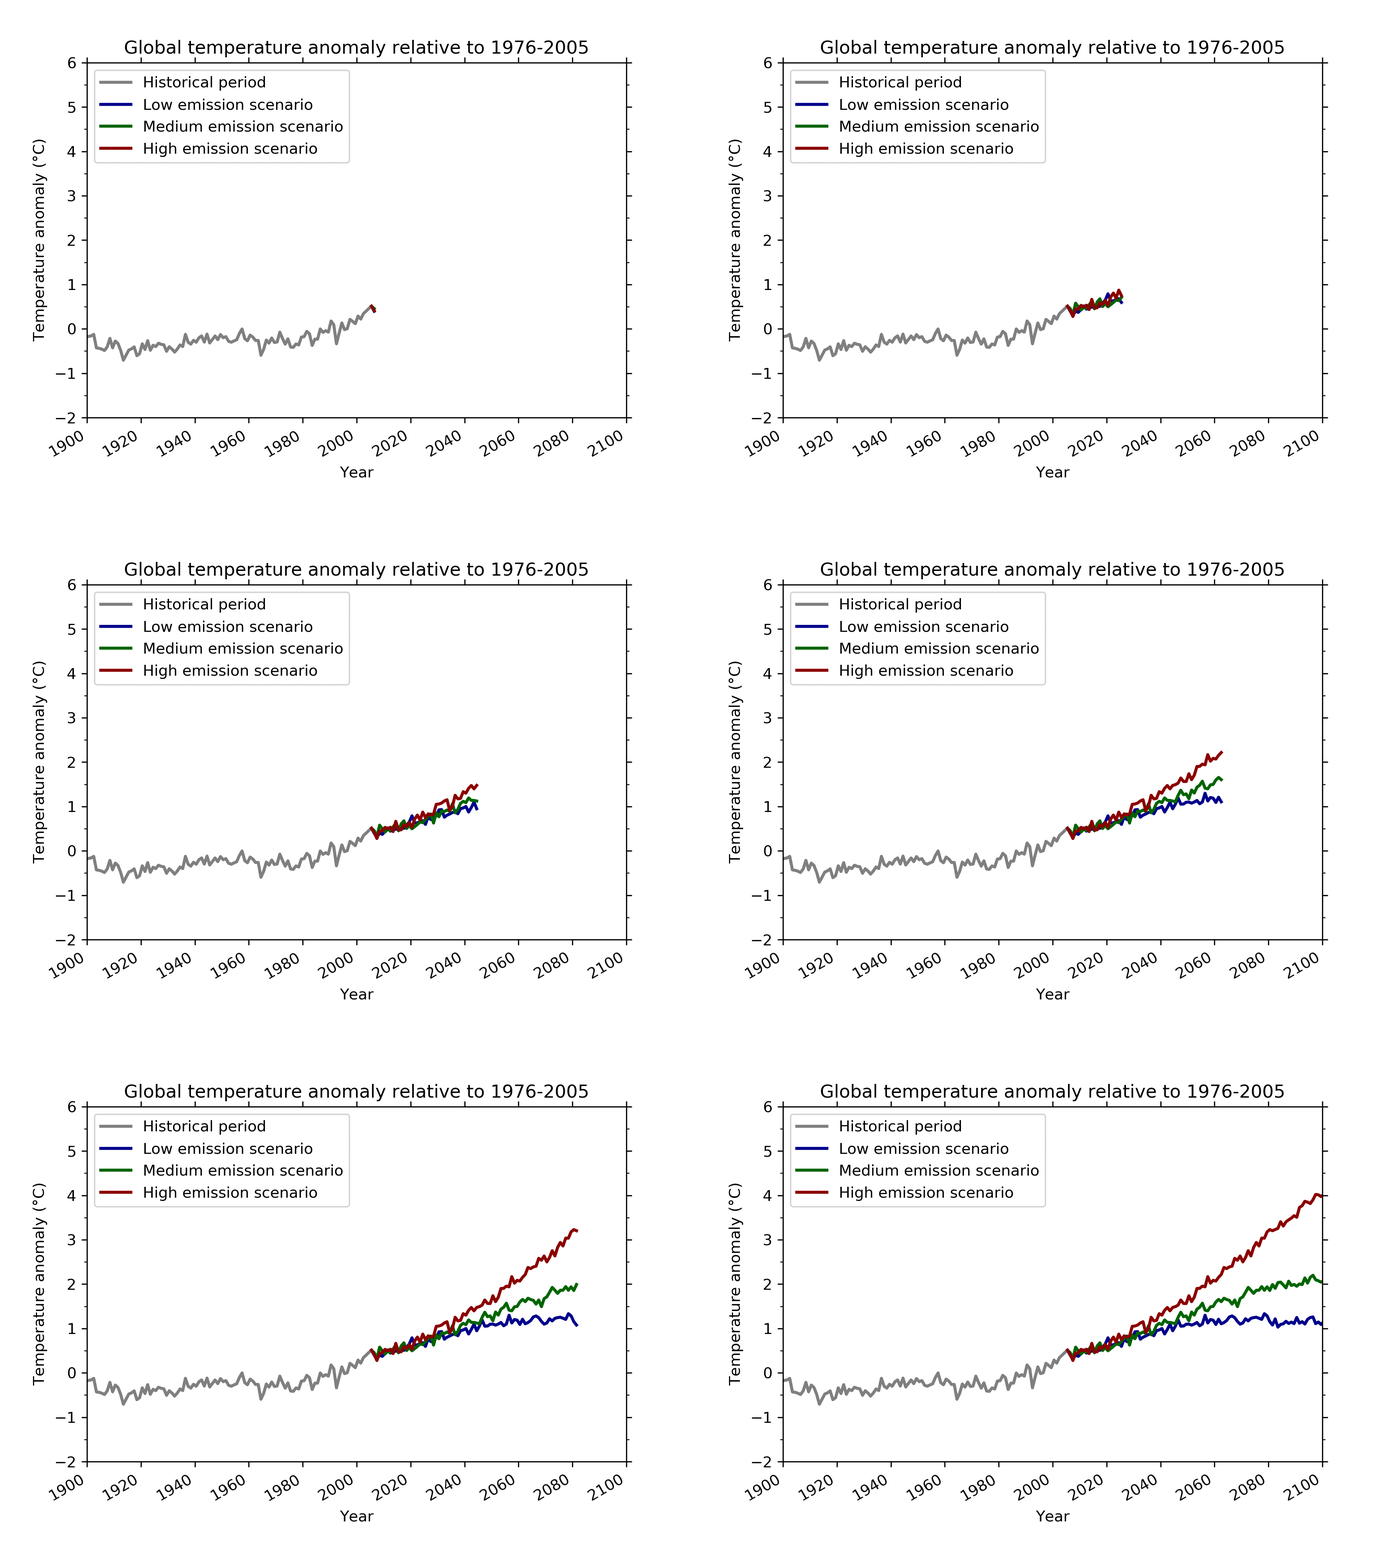
Scenario uncertainty arises because climate scientists can’t make predictions about decisions taken by politics and society. Will we continue to emit greenhouse gases as we did in the past? Or will we manage to reach the goals set by the Paris Agreement, hence limiting global warming to well below 2°C? In order to be able to make statements about the future climate we use projections based on different paths our society (read: our emissions) might take. The animation below shows the possible development of global mean temperature between 2006 and 2100 based on three such assumptions.
IPCC 2007, Moss et al. 2010 (paywall), IPCC 2010, IPCC 2017
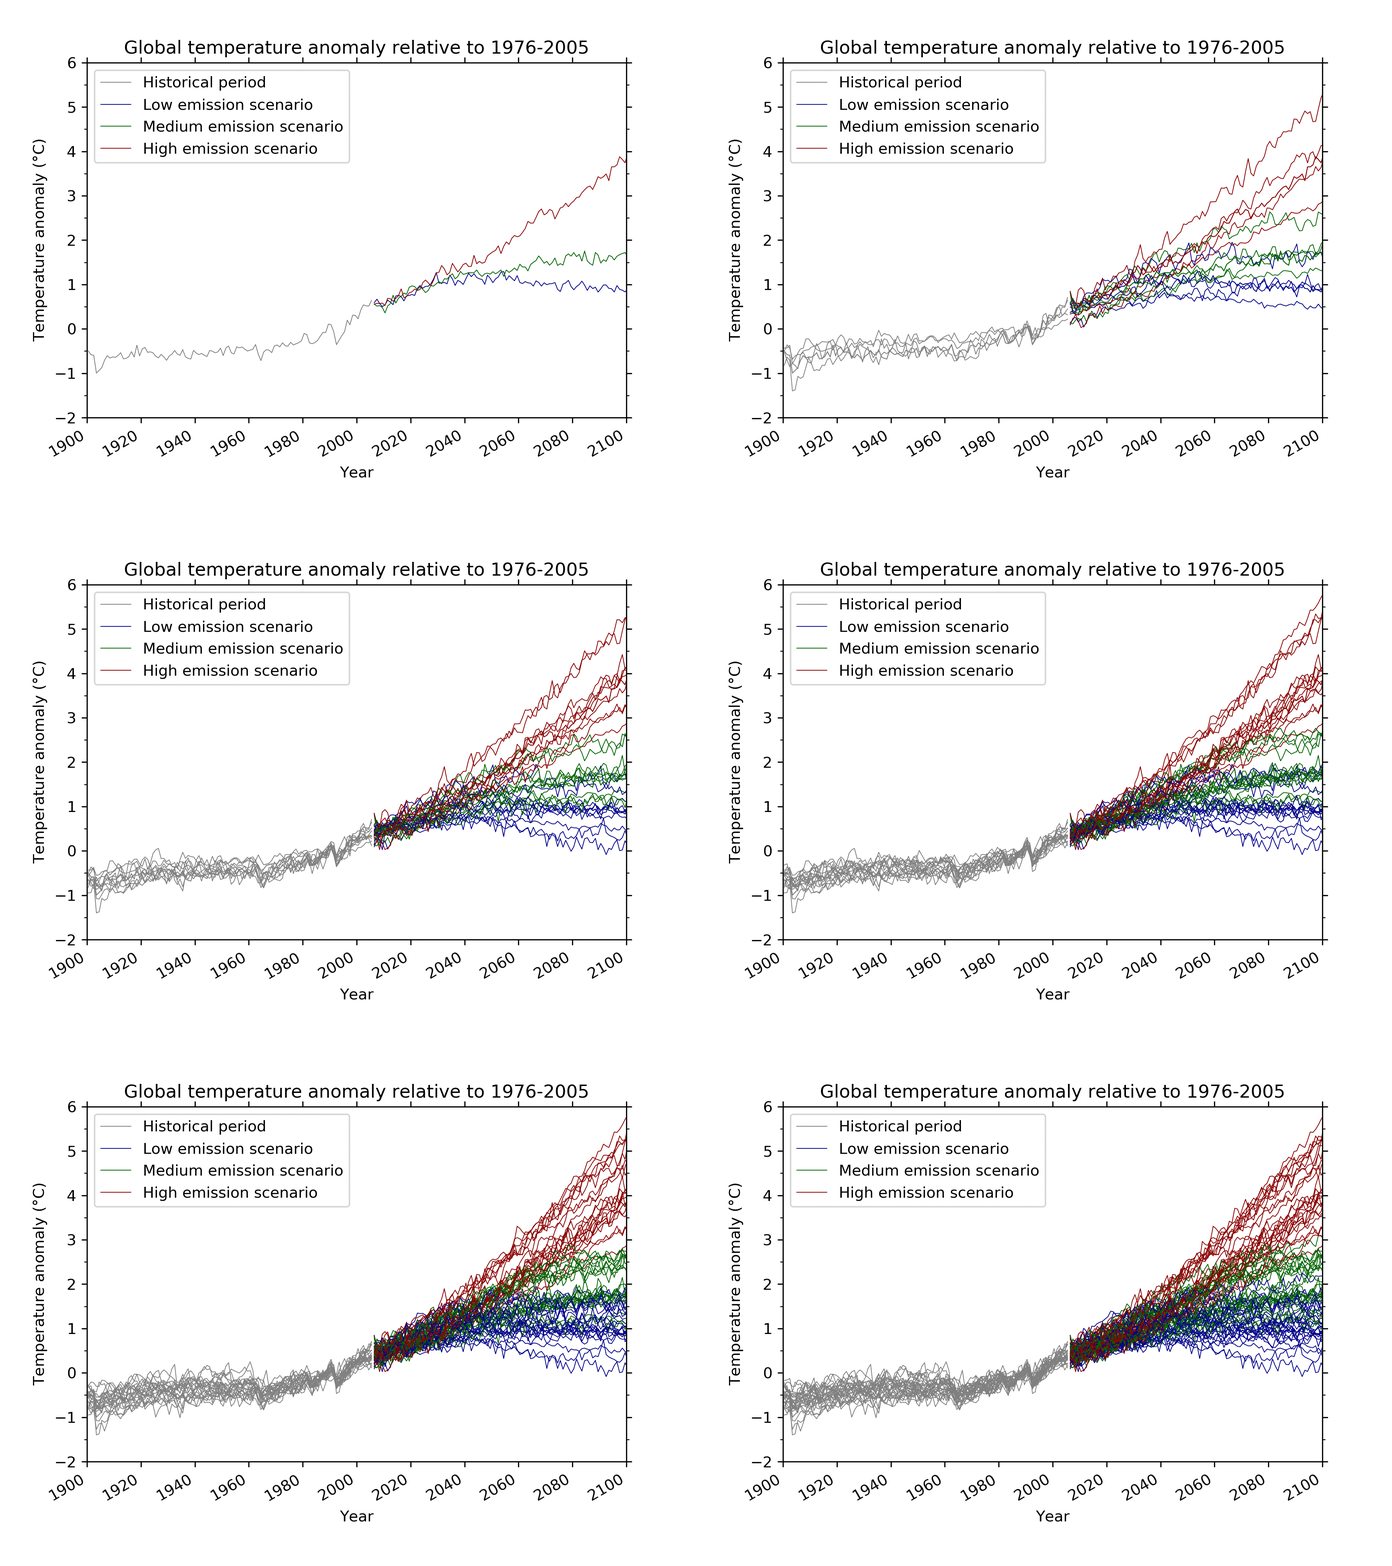
Model uncertainty accounts for the fact that climate models can never completely reproduce reality (I’ve already mentioned that the climate system is extremely complex). Models therefore use approximations to represent certain processes. Different models use different approximations and therefore yield slightly different results. The animation below consecutively adds more models for each of the three scenarios, resulting in a representation of uncertainty due to imperfect modelling.
Smith et al. 2002 (paywall), Knutti 2008, Rowlands et. 2012 (paywall),
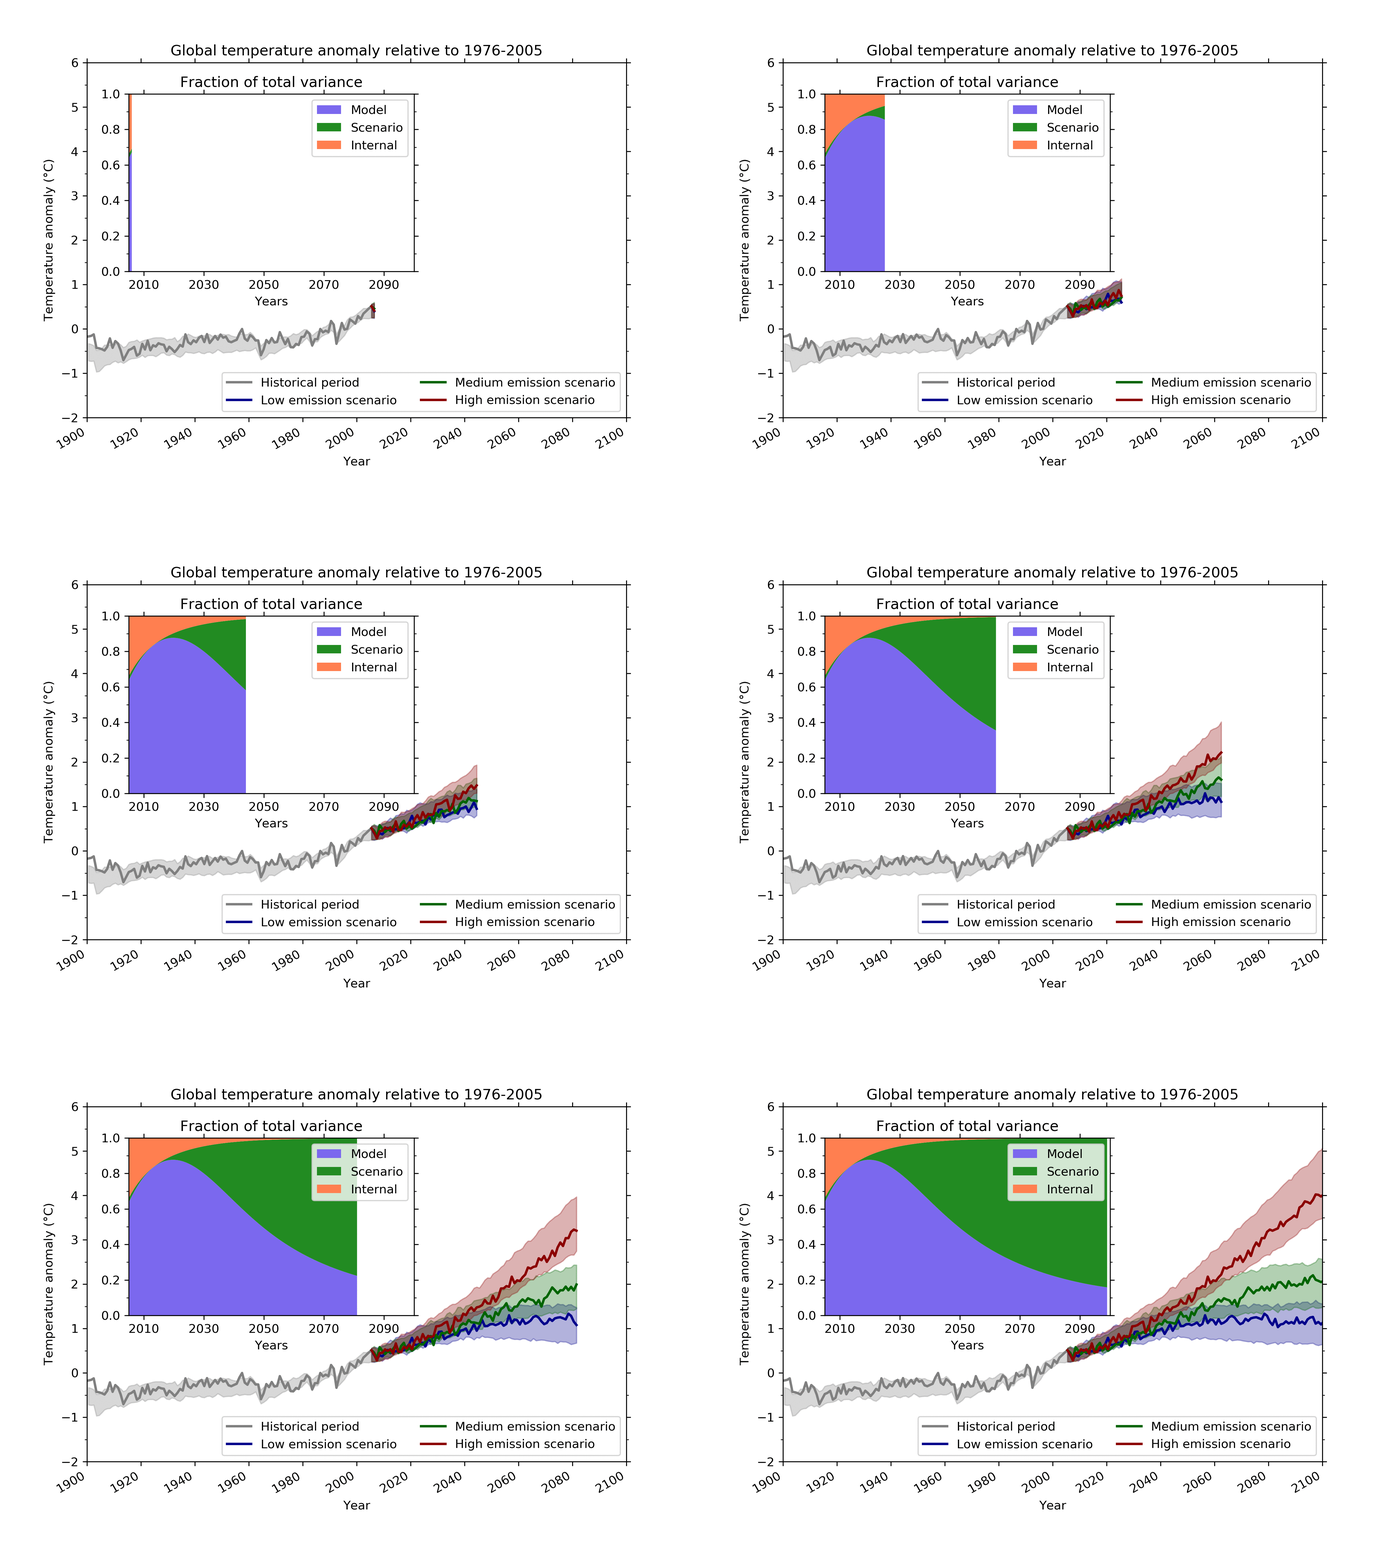
Wrap-up: I introduced the three main sources of uncertainty we face when predicting Earth’s future climate. The animation below puts it all together and shows the relative contributions from each of the three sources to the total uncertainty. As can be seen, the contributions are not constant over time. For the near future internal variability still plays an important role. Model uncertainty is most important on an intermediate time scale, while predictions for the end of the century are dominated by the scenario uncertainty.

